City Digital Twins: Projects, Models & Smart City Evidence
Explore the World's Digital Cities
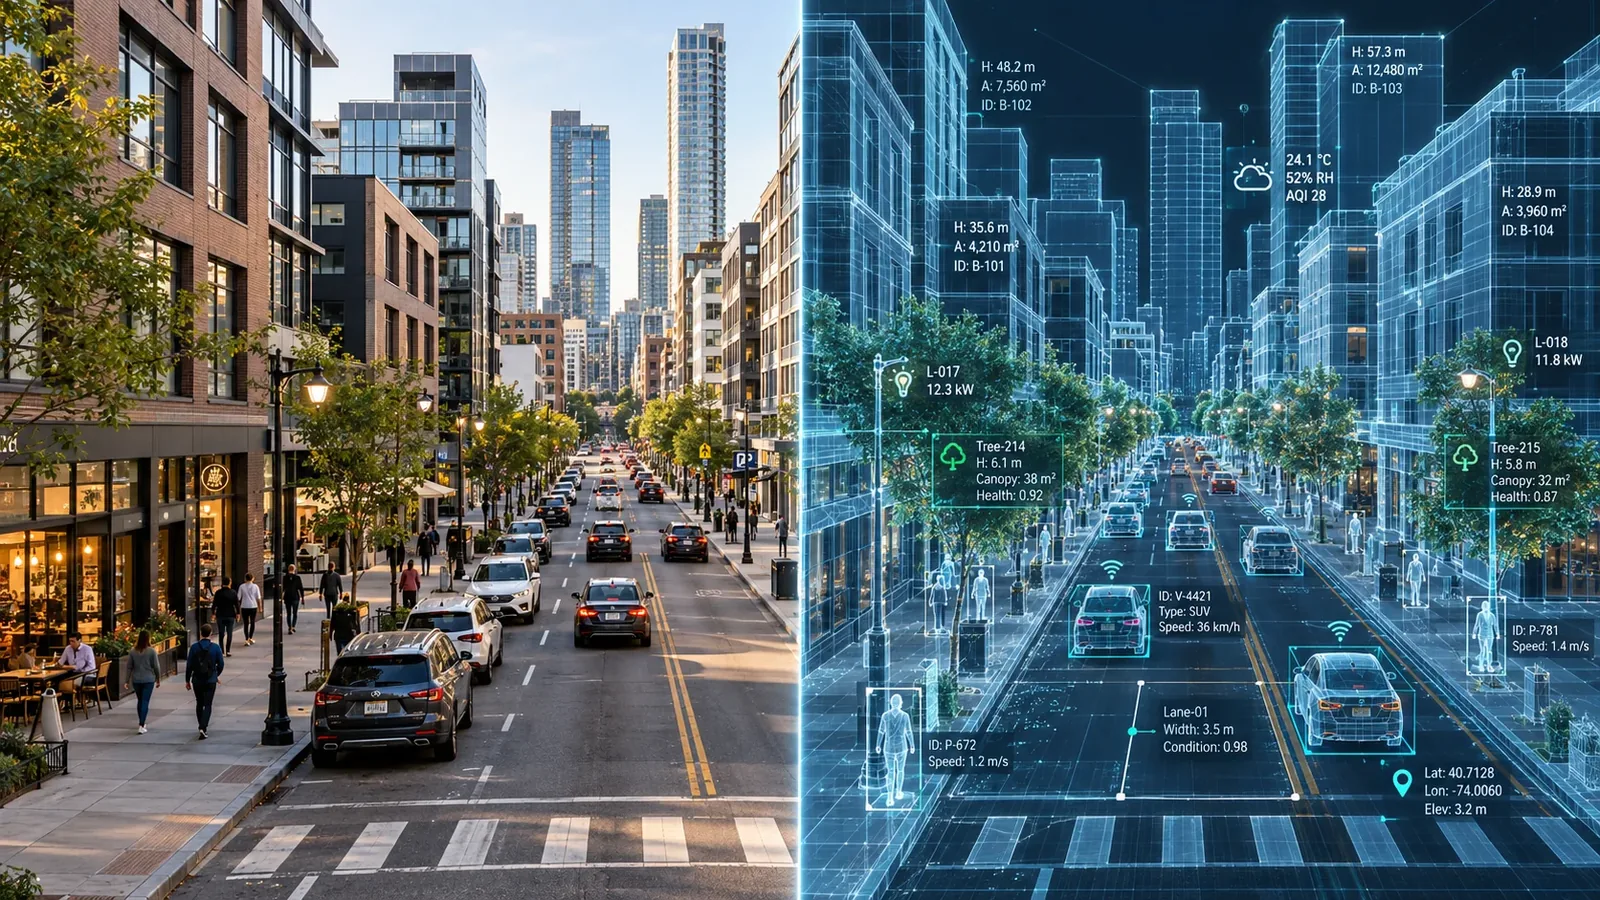
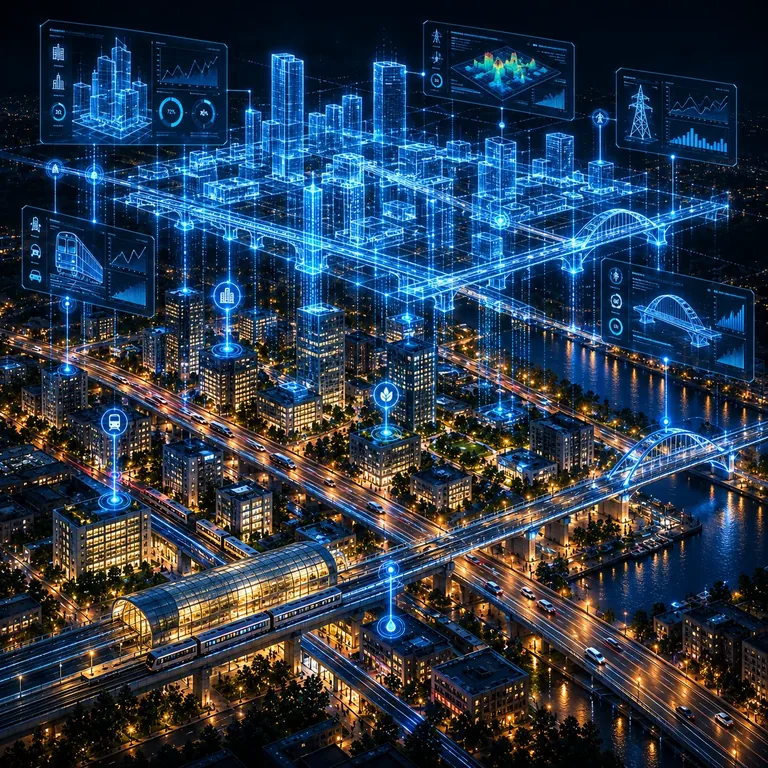
A city can be modeled as individual objects and connected to data about how its systems perform.
Explore city digital twins and documented digital twin projects worldwide, from public 3D city models to connected or operational systems. Search SCD’s directory by city, country, implementation type, lifecycle, public access, and documented capabilities; individual project profiles link to their evidence and source material.
What Makes a City Digital Twin Different from Google Maps? →⌄
WHAT MAKES A CITY DIGITAL TWIN DIFFERENT FROM GOOGLE MAPS?
Google Maps and Google Earth offer remarkable ways to explore cities, including satellite imagery, 3D buildings, street-level views, geographic information, and navigation tools.
But viewing a city in three dimensions is not the same as working with an interactive digital model of its infrastructure.
The important difference is not necessarily the visual quality of the 3D environment. Modern mapping applications can already display highly realistic cities. The distinction is what the digital model allows users to inspect, analyze, simulate, and evaluate.
An object-based city model can represent buildings, transportation networks, public spaces, and infrastructure as distinct digital objects with associated information. Depending on the implementation, users can explore their properties, overlay data, examine internal structures, adjust environmental conditions, and investigate alternative development scenarios.
Each object can have its own properties: dimensions, construction materials, energy consumption, occupancy, operational status, and much more. These properties can be examined, updated, and used in engineering calculations.
More advanced digital twins can also connect their digital objects to real-world measurements, operational databases, and simulation systems.
These capabilities can turn a visual representation into a practical environment for urban planning, engineering, analysis, and potentially city operations.
FIVE EXAMPLES: BEYOND A 3D CITY MAP
The following screenshots illustrate capabilities demonstrated in Amsterdam's ZuidasDOK digital twin platform, developed by VERO Agency using Unreal Engine 5.4.
This project is distinct from Amsterdam's municipal 3D Amsterdam city model. It provides an example of how a detailed 3D urban environment can be extended with specialized visualization, exploration, and analysis tools.
Energy and heating-transition data displayed as geographic layers within Amsterdam's 3D urban model.
EXAMPLE 1 — VISUALIZING ENERGY AND INFRASTRUCTURE DATA
A conventional 3D map shows where buildings and neighborhoods are located. A data-rich digital city model can also display information about how these areas function.
In this example, color-coded overlays represent different neighborhood energy and heating strategies, including phases of the transition away from natural gas. A timeline allows users to explore changes across different years.
Such visualization can help planners examine energy strategies geographically rather than looking at the same information only in tables or conventional maps.
Immersive exploration of the railway station environment at pedestrian level.
EXAMPLE 2 — EXPLORING INFRASTRUCTURE FROM INSIDE THE MODEL
Instead of viewing the city only from above, users can navigate within a detailed model and experience infrastructure from a human perspective.
This example shows a virtual visit to an Amsterdam Zuid railway platform, including the train, platform canopy, surrounding buildings, and architectural details.
Such immersive exploration can help engineers, planners, and stakeholders understand proposed infrastructure before construction or major modifications take place.
Time-of-day controls illustrate sunlight and shadow conditions across a three-dimensional urban environment.
EXAMPLE 3 — STUDYING SUNLIGHT AND SHADOWS
An interactive 3D city model can reproduce changes in sunlight and shadows as the sun's position changes.
The Amsterdam demonstration includes an adjustable time-of-day control, allowing users to see how illumination and shadows interact with nearby buildings and outdoor spaces.
These capabilities can support architectural visualization and preliminary examination of daylight access, shadowing, and building placement.
An interactive building cutaway reveals internal levels and architectural structure.
EXAMPLE 4 — LOOKING INSIDE BUILDINGS
A specialized 3D model can provide more than exterior building geometry.
The Amsterdam demonstration shows an interactive building cutaway with controls for selecting different floor levels. Users can reveal portions of a building's interior geometry and examine its architectural structure.
This capability can help visualize the arrangement of floors, building components, and spaces that would otherwise be hidden behind the exterior facade.
Multiple transportation modes are displayed as color-coded network layers in the same 3D city model.
EXAMPLE 5 — VISUALIZING TRANSPORTATION SYSTEMS
A conventional street map shows transportation infrastructure, but a specialized city model can bring multiple transportation systems together in an interactive, layered 3D environment.
This Amsterdam example uses color-coded lines to represent train, metro, tram, bus, cycling, and pedestrian connections.
The integrated view helps users understand how different transport modes relate spatially to one another and to surrounding buildings and infrastructure.
Such representations can support transportation planning, infrastructure coordination, and evaluation of proposed network layouts.
Images and demonstration credit: VERO Agency — Amsterdam ZuidasDOK digital twin, built using Unreal Engine 5.4. Screenshots from Amsterdam ZuidasDOK: A Digital Twin Platform Built on UE 5.4, presented at Unreal Fest 2024 and published by Unreal Engine.
These examples demonstrate how a specialized interactive 3D model can go considerably beyond conventional map viewing.
However, advanced visualization and simulation do not automatically establish that a model is a connected or operational digital twin.
A realistic 3D model may support data overlays, virtual exploration, building cutaways, or lighting simulations without maintaining a connection to the physical systems it represents.
Smart City Dispatch therefore distinguishes between:
3D City Model / Map: A spatial representation without an established operational-data connection.
Connected Digital Twin: A model with documented connections to sensor or operational data from the physical system.
Operational Digital Twin: A maintained connection demonstrably used for monitoring, analysis, simulation, or operational decisions.
Unverified Twin Claim: A project described as a digital twin without sufficient evidence to establish the required connection.
A 3D map helps us see the city. A digital twin can help us understand what is happening, evaluate what could happen, and make better decisions.
Amsterdam’s Digital Urban Planning Lab links to a public 3D city application and describes a digital twin developed with other municipalities. The public model provides a city visualization entry point. The lab’s plans to add new layers and participation tools should be distinguished from functions already demonstrated by this viewer.
Implementation type
3D City Model / Map
Lifecycle status
Operational
Public access
Public Interactive Viewer
Interactive 3D VisualizationGIS and Spatial DataBuildings and InfrastructureUrban Planning
Helsinki’s public city model combines terrain and semantic buildings with municipal registers. Visitors can inspect building attributes and explore city geometry. The city documents continuous updates to the urban data model and open data access. This entry covers the base model; the separate Energy and Climate Atlas is listed independently.
Implementation type
3D City Model / Map
Lifecycle status
Operational
Public access
Public Interactive Viewer
Interactive 3D VisualizationGIS and Spatial DataBuildings and InfrastructureUrban Planning
Helsinki’s free atlas uses the city’s 3D models to examine building energy and renewable potential. It includes modeled heating demand, solar and geothermal opportunities. These are calculated estimates rather than universal live meter readings. The service is publicly available while the city continues developing additional functions.
Implementation type
3D City Model / Map
Lifecycle status
In Development
Public access
Public Interactive Viewer
Interactive 3D VisualizationGIS and Spatial DataBuildings and InfrastructureUrban Planning
Prague’s planning institute publishes a browser application showing detailed buildings and bridges alongside a photorealistic mesh. Its documentation includes selected future development projects and navigation through the city. The listing identifies this as a public 3D planning model, with no evidence of a live operational sensor twin.
Implementation type
3D City Model / Map
Lifecycle status
Operational
Public access
Public Interactive Viewer
Interactive 3D VisualizationGIS and Spatial DataBuildings and InfrastructureUrban Planning
Rotterdam provides a public 3D model and downloadable spatial layers derived from municipal base information. Buildings, terrain, bridges, and other objects can be explored in the browser. This entry covers Rotterdam 3D, rather than assuming every capability of the city’s broader Open Urban Platform is present in this viewer.
Implementation type
3D City Model / Map
Lifecycle status
Operational
Public access
Public Interactive Viewer
Interactive 3D VisualizationGIS and Spatial DataBuildings and InfrastructureUrban Planning
Seoul describes S-Map as a 3D replica of the city used to combine spatial and administrative information. The municipality provides a public map endpoint and documents digital twin experimentation. This listing separates the public model from specialist simulation tools; the latest lightweight viewer request timed out and needs another check.
Implementation type
3D City Model / Map
Lifecycle status
Operational
Public access
Public Interactive Viewer
Interactive 3D VisualizationGIS and Spatial DataBuildings and InfrastructureUrban Planning
New South Wales provides a public spatial digital twin platform that includes Sydney and other municipalities. Its Explorer brings together government spatial layers in a browser. This listing identifies the Sydney coverage of a statewide platform, rather than implying a separate city-owned twin or uniform live data across every layer.
Implementation type
3D City Model / Map
Lifecycle status
Operational
Public access
Public Interactive Viewer
Interactive 3D VisualizationGIS and Spatial DataBuildings and InfrastructureUrban Planning
Zürich 4D presents the city’s buildings and development through time. The municipality documents an interactive public web map with regularly updated planning layers, proposed construction, and historical models. This is a visualization component of Zurich’s wider digital twin infrastructure; live sensor operations are not established for this application.
Implementation type
3D City Model / Map
Lifecycle status
Operational
Public access
Public Interactive Viewer
Interactive 3D VisualizationGIS and Spatial DataBuildings and InfrastructureUrban Planning
Amsterdam ZuidasDOK is an interactive, high-detail urban visualization developed by VERO Agency for the Zuidas district and its development area. VERO describes it as a flexible environment for exploring district development and master-planning scenarios, built with Unreal Engine 5.4. It is distinct from 3D Amsterdam, the Municipality of Amsterdam’s broader 3D city model: these are separate implementations, with different developers, purposes and technologies, and the available sources do not establish that they are one integrated platform.
Implementation type
3D City Model / Map
Lifecycle status
Unknown
Public access
Project Website / Case Study Only
Interactive 3D VisualizationGIS and Spatial DataBuildings and InfrastructureUrban Planning
Boston’s Planning Department maintains an interactive, downloadable citywide 3D model for public use. It supports exploration of the built environment and urban design context. The model is included as an accessible city representation; it is not presented as an operational digital twin with live sensor data or predictive simulation.
Implementation type
3D City Model / Map
Lifecycle status
Operational
Public access
Project Website / Case Study Only
Interactive 3D VisualizationGIS and Spatial DataBuildings and InfrastructureUrban Planning
Cape Town documents a digital twin initiative focused on public buildings and facilities, supported by a Finnish digital and green transition partnership. Municipal asset information and facilities expertise underpin the work. This is a facilities implementation, rather than a public citywide 3D viewer; the current source reports progress and collaboration.
Curitiba announced a virtual twin initiative using 3DEXPERIENCE to bring municipal departments into a shared digital environment for urban maintenance. The municipal announcement describes a new implementation direction. It is listed as in development, with planned capabilities attributed to that announcement and no verified public viewer or completed rollout.